KPI Dashboards with n8n and Airtable
8 March 2026
A client of mine was struggling to understand and manage delivery performance. They had disparate data sources and no collective place to present and understand the data. I worked on a small project to ingest all of that data and present it in dashboards to enable better decision making and improve performance management.
1. Data Ingestion
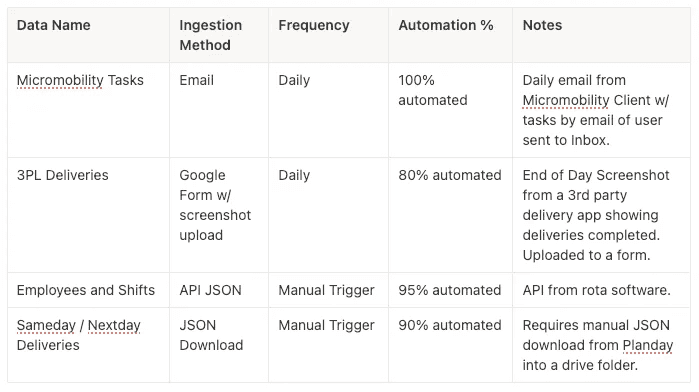
Primary data sources:
- End of Day Screenshot from a 3rd party delivery app showing deliveries completed.
- Daily email from Micromobility Client w/ tasks of each user.
- Shift Data from the HR / Rota platform.
- Employee Data from the HR / Rota plaform
2. Building the Tech Stack for the Dashboards
The tech stack that I decided to construct the KPI dashboard was the following:
- Data ingestion / conversion = n8n
- Form for Data Entry = Google Forms
- Rota/HR Platform = API
- Database + Dashboard Front End = Airtable
- OCR Data Scraper = Mistral OCR
- Generative Ai Data Scraper = Open Ai Model gpt-4.1-mini
Why n8n? I decided to use n8n because it looked to be the easiest to incorporate generative AI bots and basic coding vs Zapier / Make (I actually use these for other automations and they may well be up to the task). I found it so easy on n8n to track what data was flowing because it shows JSONs as tables and you can select which item you want to flow through and drag and drop.
Why Airtable? I had used airtable only a couple of times before, it looked to be the best option for a no code database + dashboard. I did consider Google Firebase + Looker, but I thought this would be a much steeper learning curve. A downside of Airtable is that there are really limited options for displaying the data.
Open Ai ChatGPT APIs — setting up APIs is a scary idea. A super complicated task for non-technical folk, actually no. I setup an account then topped up $10 credit. Within settings there are the API keys section where you can click + to create new secret key (remember to note the API keys down!). This can then be used in n8n and other platforms to call different models. I used 4.1-mini as it was low cost, only spend about $1 in 2–3 months.
3. Automating Data Ingestion via n8n
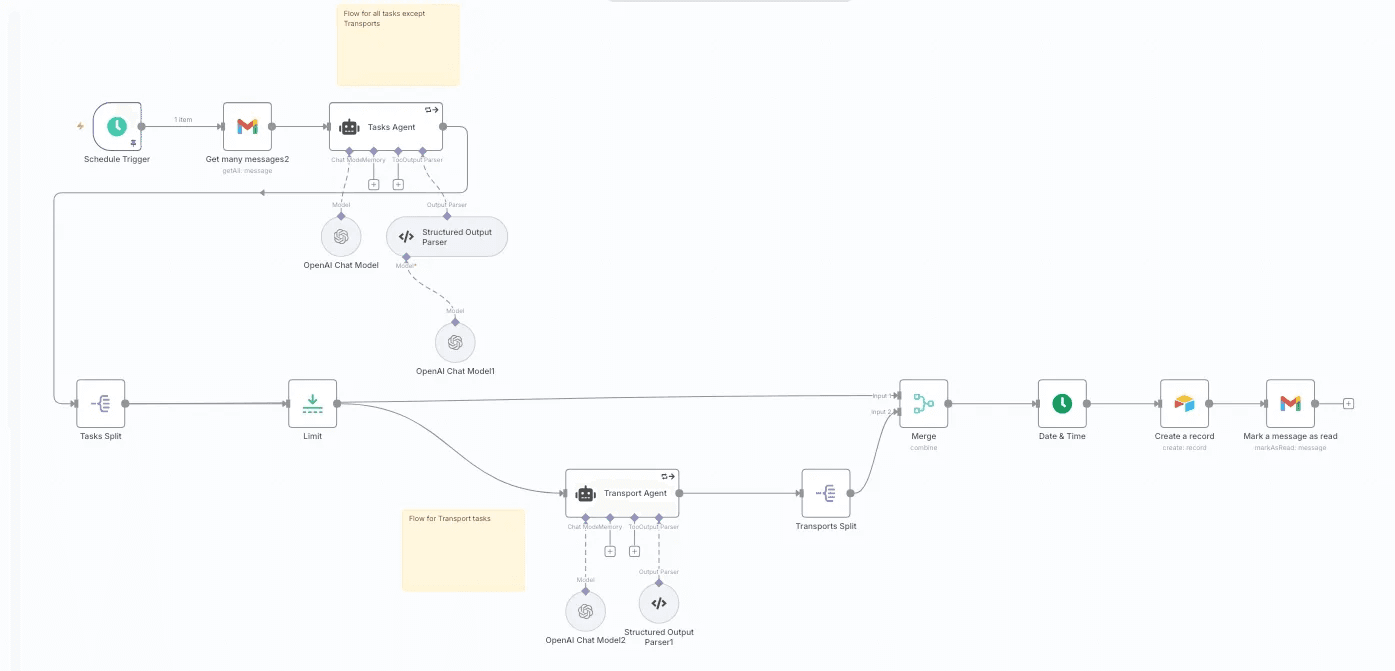
Example #1 — Data Ingestion Workflow — Micromobility Tasks
Press enter or click to view image in full size
For initial setup I need to create API keys for Gmail, Open AI, and Airtable. This was relatively simple to do in all of the platforms. and then pop into the node in n8n.
So node by node:
- Schedule Trigger — this triggers the workflow at 10am each day.
- Get Gmail Messages — setup to get the unread message from a specific label (filtered in Gmail)
- Agent — I used an Open Ai prompt with Structured Output Parser (this basically gets ChatGPT to put in a set JSON format to be read by the rest of the workflow.
- Intermediate Steps to filter the correct data through the workflow.
- Airtable — a base is setup in Airtable with the relevant headers, then in the Node to ingest the data.
- Gmail — mark the email as read so that it is not ingested again
A little aside on Mistral OCR — I used this on a different flow to extract data from a screenshot. It will once connected get text / numbers from an image and convert to a markdown that can be inputted into an Agent to structure into a JSON that is then ingested into Airtable.
Example #2 — Data Ingestion Workflow — Shifts via API
Data Ingestion workflow using HTTP requests.
This one was slightly different as it didn’t require the usage of an AI agent. I setup API keys in the Rota/HR software (client ID + refresh token). One node is setup to get the authorisation token via POST, then the second node uses that to pull the data from the right date using GET.
The data pulled from the system is in JSON schema so can be directly ingested into Airtable.
Building the Database and Dashboard in Airtable
- Base Setup — Setting up each for the bases to incorporate the data from the workflows is simple, similar to putting column headings on an excel sheet. The only thing to keep an eye on is the data format (integer, number, string etc) such that it matches the workflow data.
- KPI Formulas — Calculating key KPIs required using the formula functionality within each field. For example:
- Success Rate % KPI — was successful deliveries / total deliveries.
- Attempt Rate % KPI — was [successful deliveries + Cannot deliver] / total deliveries.
- Task Pay Estimates — successful deliveries * task rate in £
- Gross Margin Estimate % — [Task Revenue Estimate — Task Pay Estimate] / Task Revenue Estimate
3. Linking to other bases — This was required to match shift hours to tasks. It matches based on a set field e.g. employeeID. It works in a similar way to VLOOKUP/XLOOKUP in excel.
4. Automations to avoid manual work — Two main purposes were to automatically link data between bases when it was ingested and to create “dropdown” fields to enable filtering in dashboards e.g. by week.
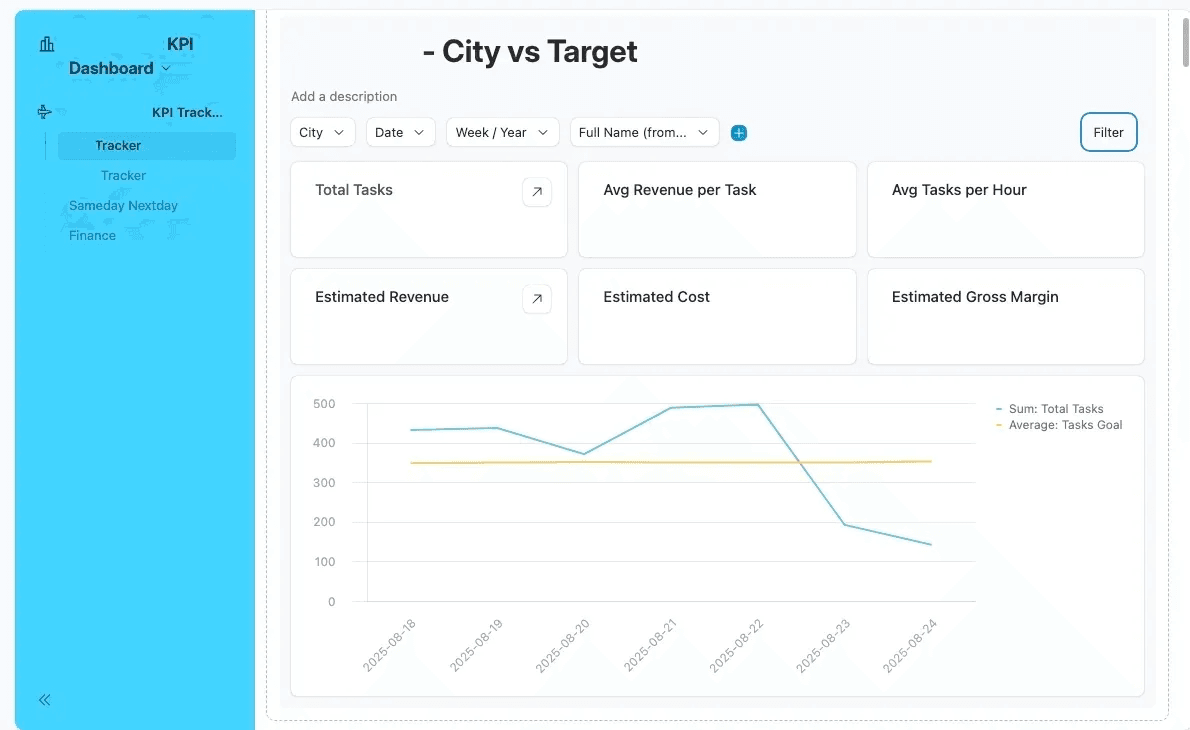
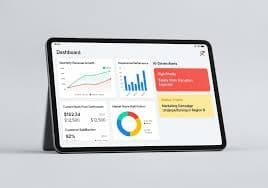
5. Building the Dashboards — The dashboard building is pretty intuitive in Airtable you can choose to display specific numbers e.g. Total Tasks (sum of tasks) or a graphic of the data. It is limited in what graphs can be show. Also you can display data from different bases in one interface as far as I am concerned.
So how long did it take?
A lot of time was spent learning as I went, so I would say that minimum 50% of the time was just spent learning and testing. I estimate that I spent between 50 to 60 hours building all of the automations, the Airtable databases, and the dashboards.
50% Learning Time — 25 to 30 hours — 3 to 4 working days.
50% Application — 25 to 30 hours — 3 to 4 working days.